The Relative Strength Index (RSI) is a momentum oscillator that measures the speed and magnitude of recent price movements to identify overbought or oversold conditions in an asset. It ranges from 0 to 100 and is commonly used to spot potential reversal points, confirm market trend strength, and assess the overall direction of market trends, especially when paired with support and resistance levels.
Originally developed by J. Welles Wilder Jr. in 1978, RSI has become one of the most widely used technical indicators across markets—including stocks, forex, crypto, and commodities. By mastering RSI trading signals, traders can enhance their timing, improve decision-making, and increase profitability. In this article, we’ll explore how RSI works and how to use it effectively to strengthen your trading strategy.
How is RSI Formula Calculated?
RSI is a momentum oscillator that measures the speed and change of price movements. It is calculated by comparing the average gains and losses over a specific period, typically 14 days. It helps traders to determine whether an asset is overbought or oversold.

 RSI Formula:
RSI = 100 − [100 / (1 + (Average Gain / Average Loss))]
Breaking It Down:
- Average Gain: The average of price increases over the defined period.
- Average Loss: The average of price declines over the same period.

The RSI calculation helps traders assess whether an asset is trending up or down by comparing the magnitude of upward price movements to downward price movements.
 Adjusting RSI Periods Based on Market Conditions
The default RSI setting of 14 periods is widely used because it balances responsiveness and smoothness. However, traders often adjust the period to match their trading market better.
- Shorter periods (example 7-9) for RSI become more sensitive to price changes, giving quicker signals. This is typically used in volatile markets where rapid price fluctuations occur. The disadvantage is that it can lead to more false signals reacting to minor fluctuations, and traders may enter and exit trades too frequently.
- Longer periods (example 21-30) for RSI become less reactive, smoothing out short-term noise. Long-term traders or investors often use this setting to focus on significant market trends such as commodities. The disadvantage is that RSI may be slower in reacting to price changes, meaning that traders may miss out on early trend shifts or reversals.
How RSI Works in Trading
RSI determines if an asset is overbought or oversold, signalling potential reversals. By measuring the momentum of price changes, the RSI provides insights into the strength or weakness of an asset’s price movement.
The indicator moves from 0 to 100, with key levels at 70 (overbought) and 30 (oversold).
 RSI Overbought Condition (Above 70):
When RSI exceeds 70, it suggests that the asset is overbought, and a pullback or reversal may be imminent. This can often coincide with price reaching resistance levels.
 Action: Traders often sell when the RSI exceeds 70, anticipating a market correction near resistance.
Example: If the EUR/USD pair has an RSI of 80, it may indicate an overbought market, signalling a potential price decline as the price approaches resistance.

 RSI Oversold Condition (Below 30):
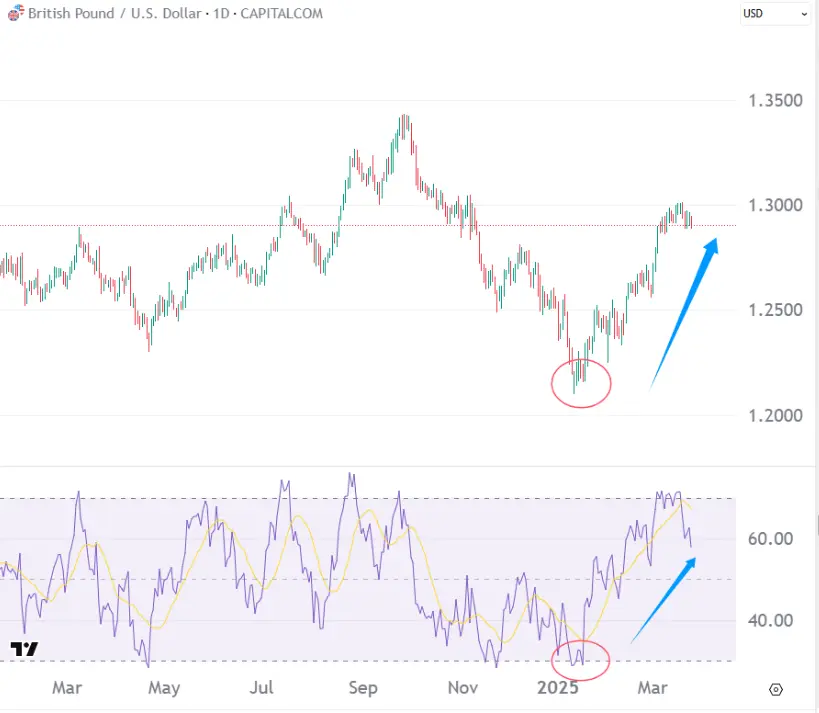
When RSI drops below 30, it suggests the asset is oversold, and a price rebound may be on the horizon, especially when approaching support levels.
Action: Traders often look for buying opportunities when RSI is below 30, anticipating a reversal at support.
Example: If the GBP/USD pair has an RSI of 25, it could mean the British pound is oversold and may be due for a reversal, potentially bouncing off a key support level.
RSI Divergence: Spotting Trend Reversals
RSI divergence occurs when the price of an asset moves in the opposite direction of the RSI. This is a key signal for potential trend reversals:
 Bullish Divergence
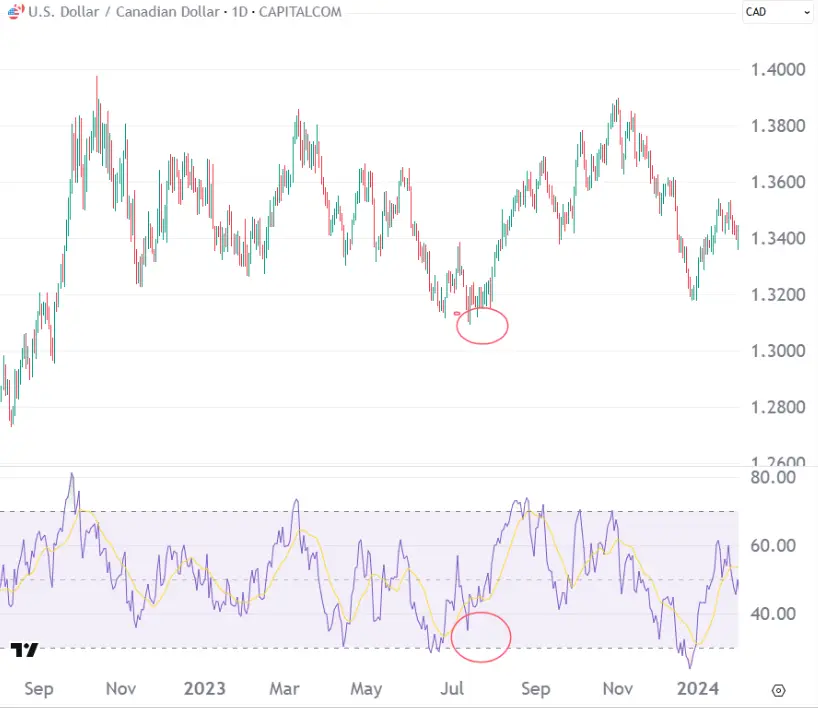
Occurs when the price makes lower lows, but the RSI forms higher lows. This suggests that selling momentum is weakening and that a price reversal to the upside may happen.
Example: If USD/CAD makes a new low, but the RSI forms a higher low, a buy signal may appear.
Bearish Divergence
If the price makes higher highs but the RSI fails to make new highs, it suggests a weakening of buying momentum and a possible downward reversal.
Example: If USD/CHF makes new highs but RSI shows lower highs, it signals a sell signal.

RSI Centerline Crossovers: Identifying Trend Strength
 The RSI centerline (50 levels) is critical for confirming the strength of an existing trend:
- RSI Above 50: When RSI remains above the 50 level during an uptrend, it signals strong bullish momentum, confirming that the price will likely continue moving upward.
- RSI Below 50: When RSI remains below the 50 level during a downtrend, it indicates strong bearish momentum, suggesting that the downtrend is likely to persist.
Crossovers at the 50 level provide additional confirmation of a trend’s strength. For instance:
- If RSI crosses above 50 from below, it can signal the start of an uptrend.
- Conversely, if RSI crosses below 50 from above, it may signal the beginning of a downtrend.

RSI Trading Strategies and How to Use It in Your Strategy
RSI trading is most effective when combined with other technical indicators, trend analysis, or market conditions. Below are some strategies for using RSI:
Identify Overbought/Oversold Conditions:
Use the RSI to detect when an asset is overbought or oversold. Buy when the RSI is below 30 (oversold) and sell when the RSI is above 70 (overbought).
- RSI above 70 = overbought = potential sell.
- RSI below 30 = oversold = potential buy.
 Spot Divergence for Trend Reversals:
Look for divergence between price action and RSI to spot weakening trends and predict potential reversals.
- Bullish Divergence: Price makes lower lows, RSI makes higher lows. Buy.
- Bearish Divergence: Price makes higher highs, RSI makes lower highs. Sell.
 Confirm Trend Strength:
Use RSI to confirm the strength of an ongoing trend. RSI readings above 50 confirm bullish momentum, while readings below 50 confirm bearish momentum.
- RSI > 50: Indicates a strong uptrend.
- RSI < 50: Indicates a strong downtrend.
 Centerline Crossovers:
The 50 level of RSI is critical for confirming the direction and strength of the trend. Use it to gauge potential buy or sell signals.
- Crossing above 50: Potential uptrend.
- Crossing below 50: Potential downtrend.
Best RSI Settings for Different Markets
The default RSI setting is 14 periods, but it can be adjusted based on market conditions and trading style.
| Market Type | Best RSI Setting | Trading Style |
| Stocks | 14 | Swing Trading |
| Forex | 9 or 14 | Intraday & Swing |
| Crypto | 7 or 14 | High Volatility |
| Commodities | 10 | Trend Confirmation |
 Pro Tip: Shorten RSI settings (e.g., 7-9 periods) for faster signals in volatile markets like crypto.
 How to Set RSI in MetaTrader 4 (MT4)
Setting up RSI in MT4 is simple and quick. Follow these steps:
- Open MT4 and select the chart you want to use.
- Click on Insert → Indicators → Oscillators → Relative Strength Index.
- Adjust the Period (default is 14) based on your strategy.
- Modify Levels (30 for oversold, 70 for overbought) if needed.
- Click OK to apply the RSI indicator to your chart.
Now, you can use the RSI to identify overbought or oversold conditions and make informed trading decisions directly within MT4.

RSI Trading Strategy Tips
- Combine RSI with Other Indicators: Use RSI in trading alongside other technical indicators like moving averages or MACD to increase the effectiveness of your strategies.
- Watch for Extreme RSI Readings: Look for situations where the RSI exceeds extreme levels (above 70 or below 30), as these can indicate potential reversal points.
- Use RSI with Trend Analysis: If the market is in a strong trend, RSI can be used to identify pullbacks in the trend, offering more favorable entry points.
Common Mistakes to Avoid While Using RSI
Even professional traders misuse RSI, leading to false signals and unnecessary losses. Here’s what to avoid:
 Relying on RSI Alone – Always confirm signals with other indicators.
Not Checking Market Trends – RSI is more effective in ranging markets.
Ignoring Divergence Signals – RSI divergence can predict reversals early.
Using Default RSI Without Testing – Customize RSI settings for your trading style.
Pro Tip: Always backtest RSI strategies in a demo account before trading live.
Maximizing Trading Potential with RSI Strategies
To get the most from RSI, use these proven trading strategies:
 RSI Trend Strategy – Follow RSI direction above/below 50.
RSI Reversal Strategy – Trade based on RSI divergence.
RSI Scalping Strategy – Use RSI + MACD for short-term trades.
RSI & Bollinger Bands – Identify volatility breakouts.
Final Tip: Test RSI strategies in a demo account before trading live to refine your approach.
Conclusion
The Relative Strength Index (RSI) is a powerful tool that helps traders identify overbought and oversold conditions, spot trend reversals, and confirm the strength of existing trends. Mastering RSI trading and understanding its signals can enhance your market analysis and help you make more informed trading decisions.
Integrating RSI into your strategy can provide valuable insights and improve your trading performance, whether you’re trading stocks, forex, or crypto.